HydroBrain
Smart Hydroponic Tower
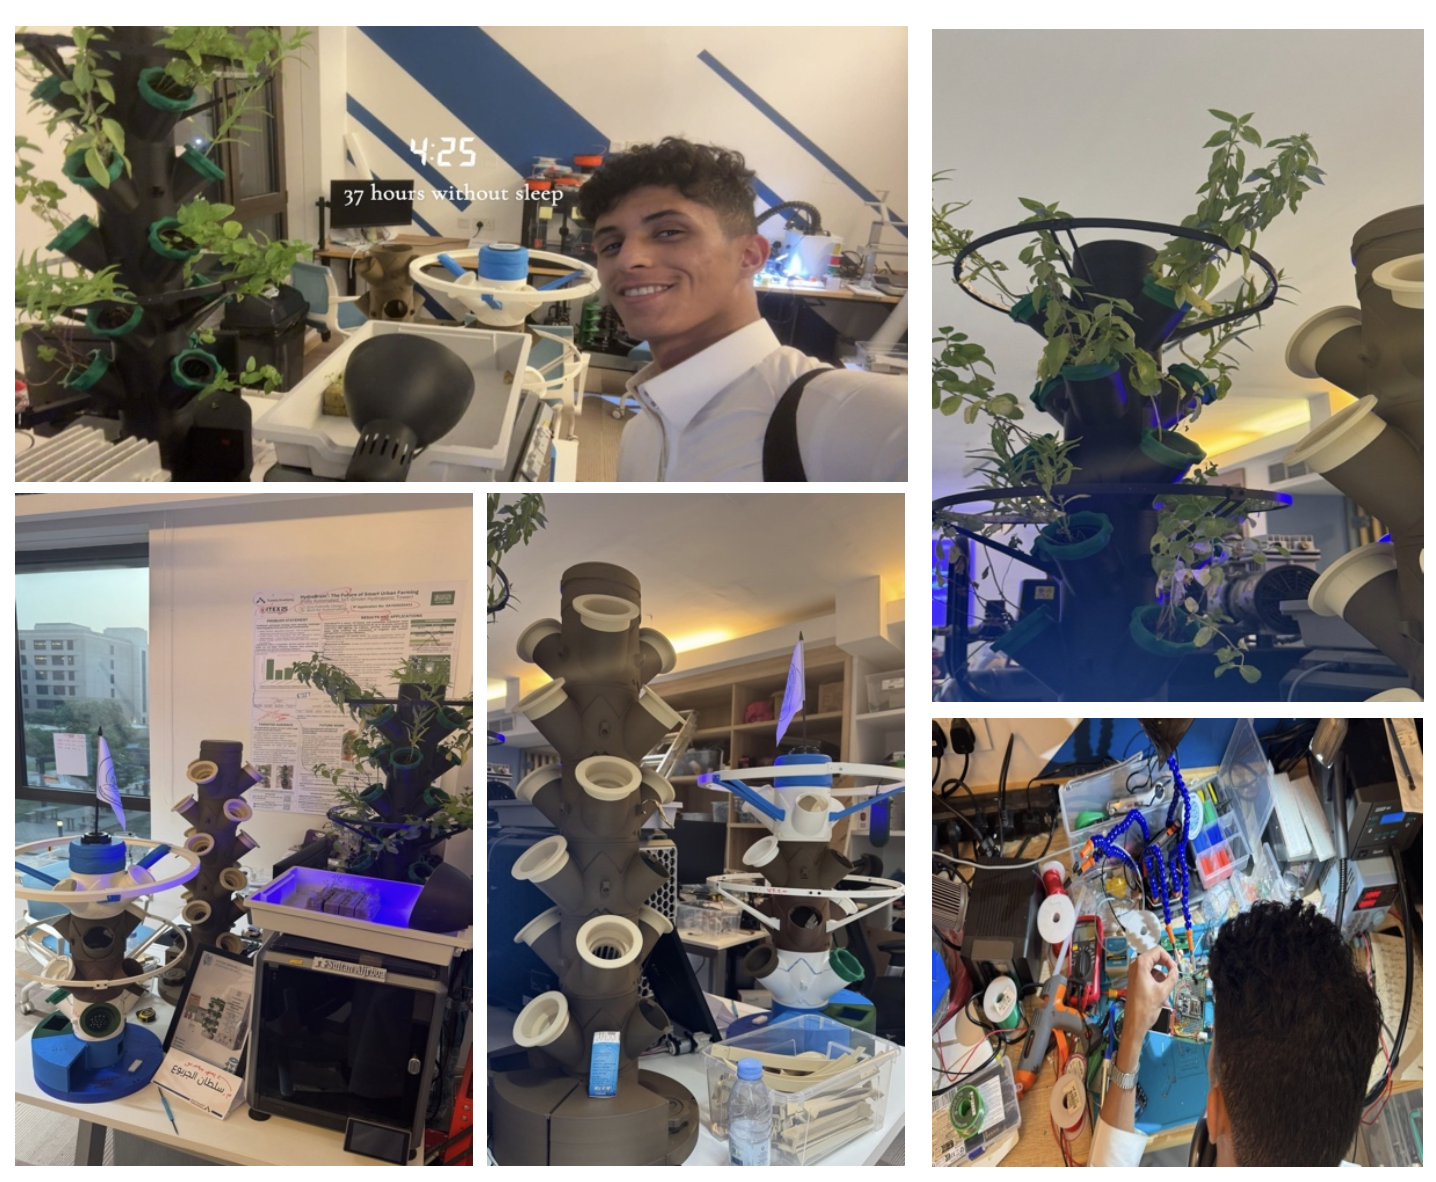
HydroBrain prototype overview and system demonstration.
HydroBrain is a smart hydroponic farming system designed to grow plants without soil using IoT-based monitoring, embedded control, automated irrigation, LED lighting modes, pH/TDS sensing, and cloud-based dashboards.
The Problem
Traditional soil-based agriculture faces several constraints: high water consumption, limited arable land, climate instability, and inefficient use of water, land, and nutrients. In hydroponic systems, maintaining the correct pH is also critical because pH directly affects nutrient availability and plant uptake.
- Agriculture consumes a large share of global water resources.
- Urbanization and land degradation reduce available farming space.
- Climate change increases crop-production uncertainty.
- Incorrect pH and nutrient imbalance can reduce plant health and growth.
The Solution
HydroBrain was designed as an intelligent, self-regulating hydroponic tower. The system monitors growth conditions in real time and provides automated control through embedded hardware, sensors, cloud connectivity, and user interfaces.
- Auto pH control using dedicated pH adjustment pumps.
- DHT22-based air temperature and humidity monitoring.
- Water temperature and water-level monitoring.
- TDS sensing for nutrient concentration tracking.
- ESP32-based Wi-Fi control and cloud synchronization.
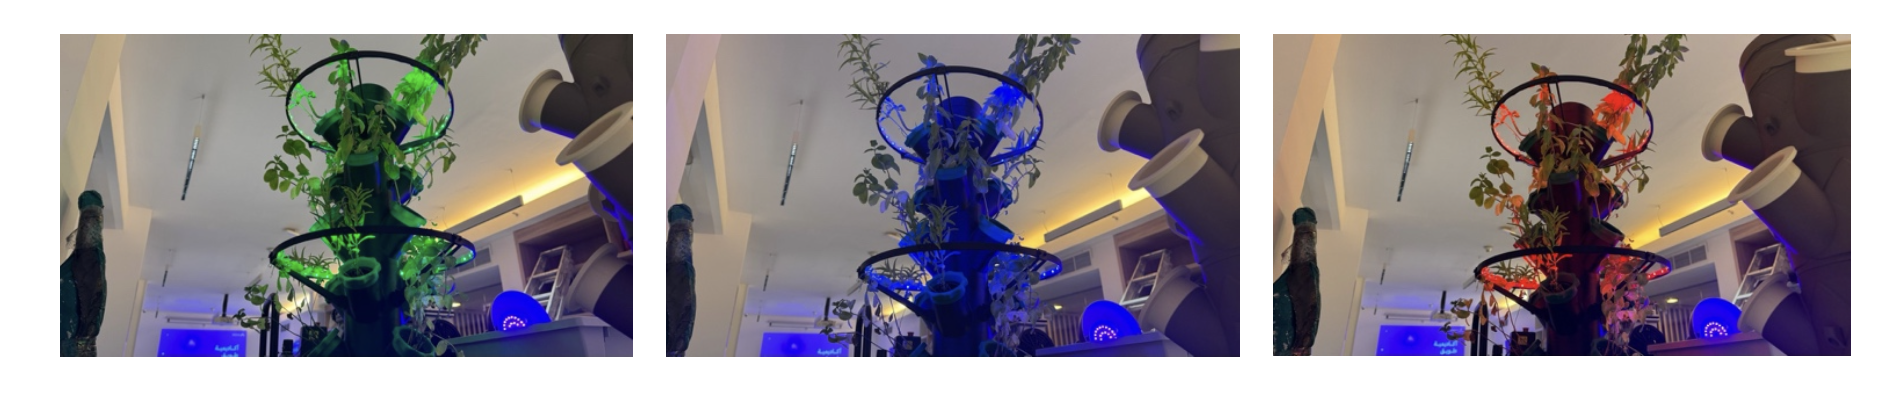
- LED lighting with Sun, Relaxing, and Sleeping modes.
- TFT display, web dashboard, and mobile access.
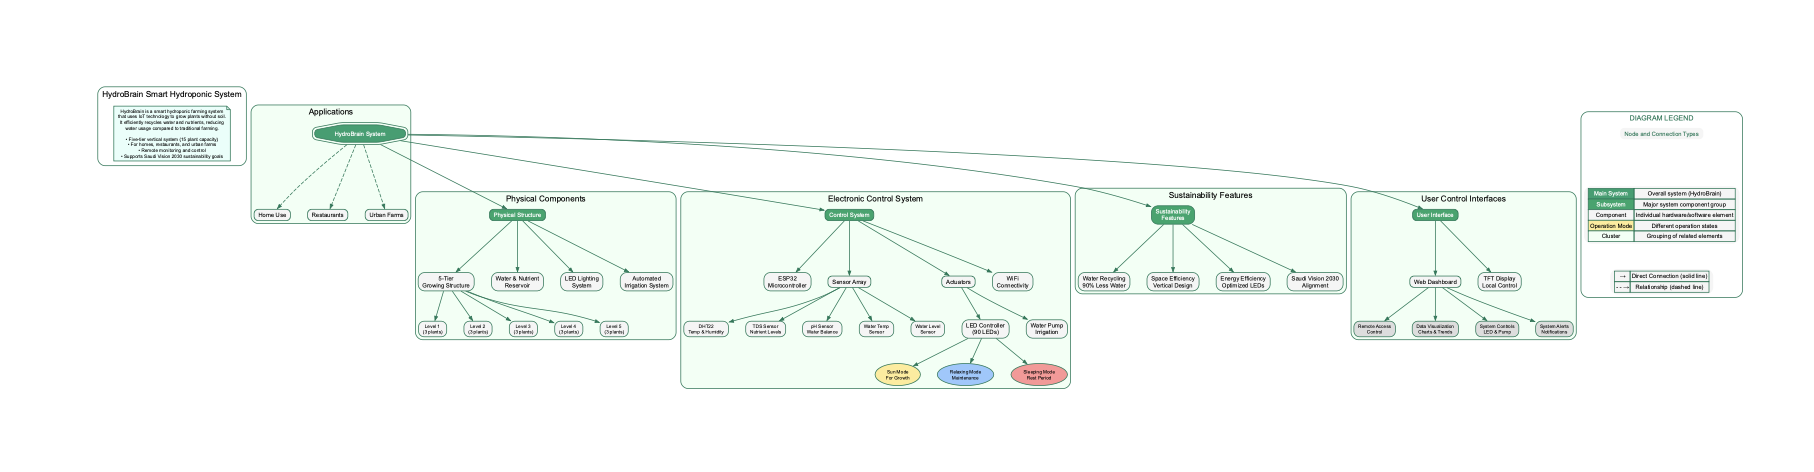
System Architecture
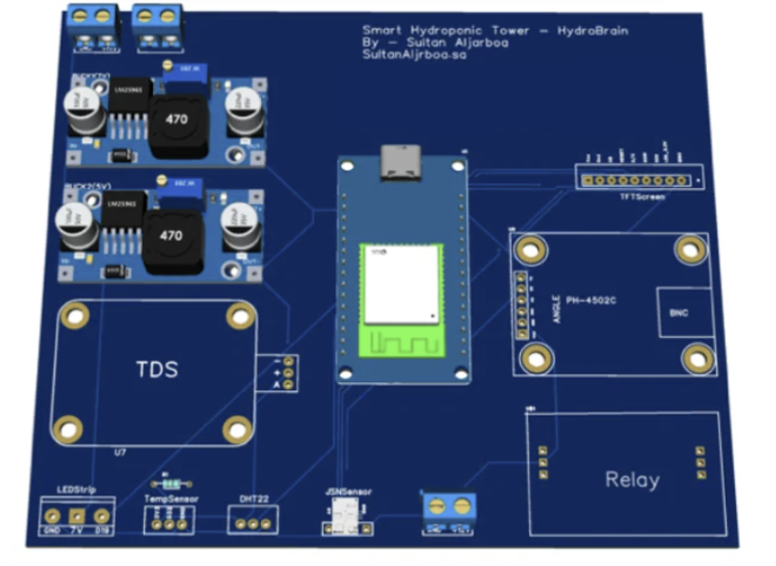
The system architecture connects sensors, actuators, the ESP32 controller, cloud storage, and user interfaces. Sensor readings are collected from the tower, processed by the controller, then displayed through the TFT screen and dashboard.
- Sensor layer: pH, TDS, air temperature, humidity, water temperature, and water level.
- Control layer: ESP32 microcontroller.
- Actuation layer: water pump, pH adjustment pumps, and LED controller.
- Interface layer: TFT display, web dashboard, and mobile access.
- Cloud layer: real-time data logging and dashboard visualization.
Dashboard & Data Logging
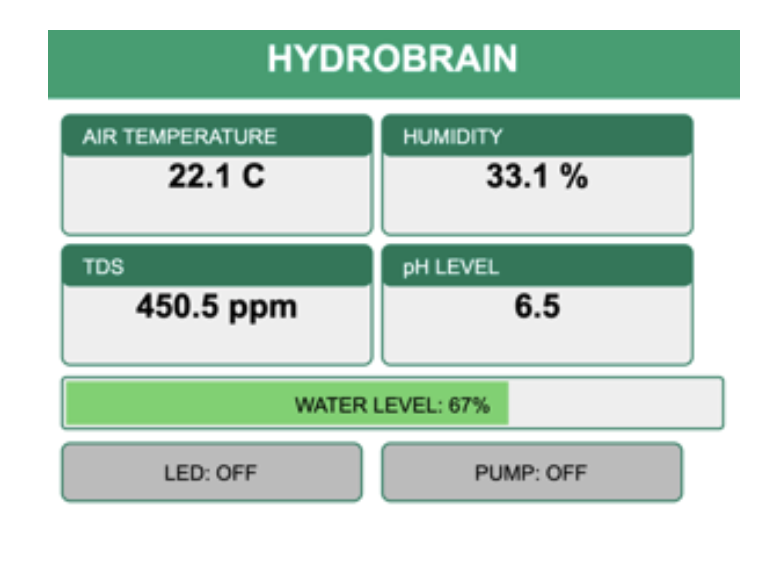
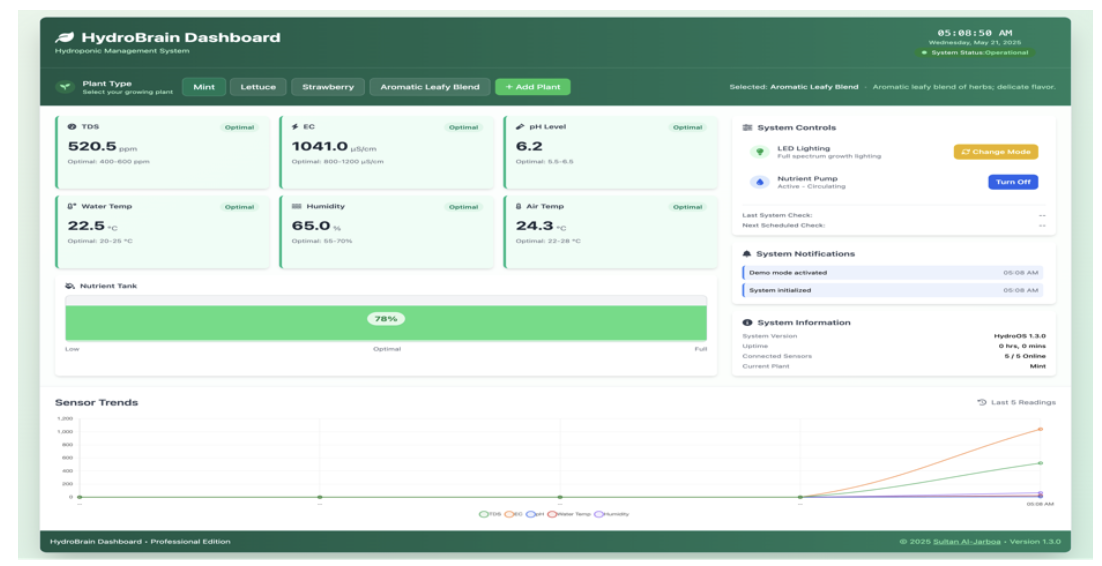
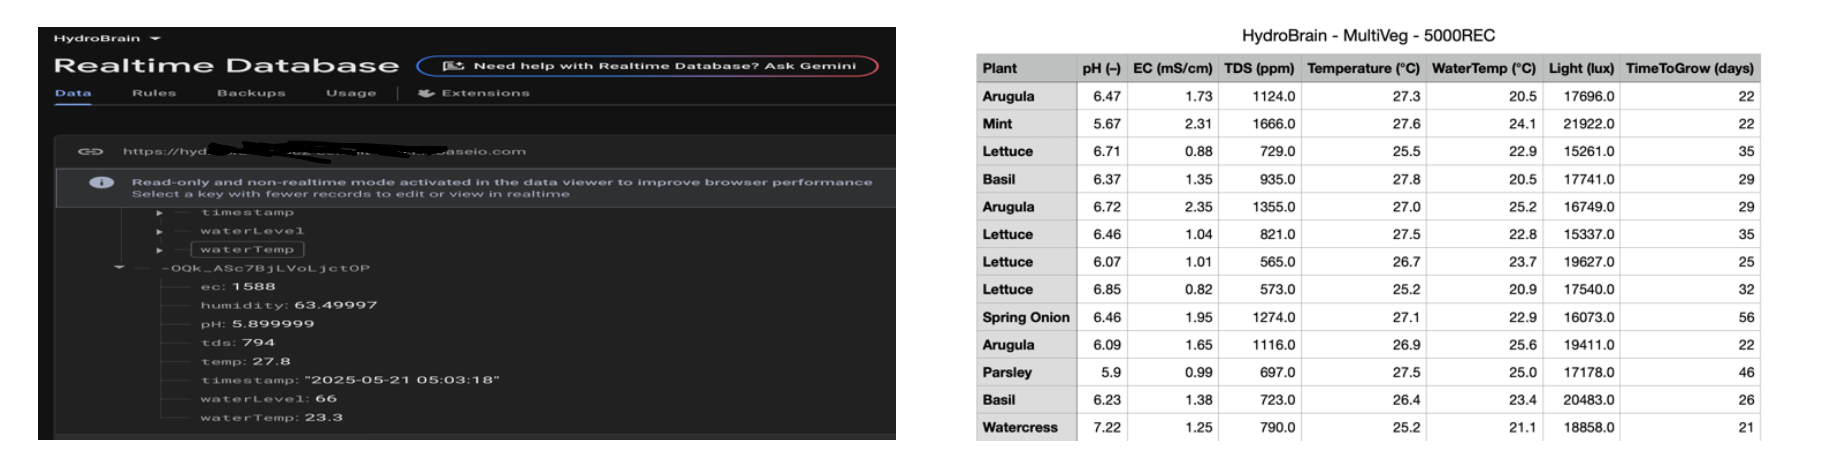
Sensor data was recorded every 15 minutes and uploaded to Firebase for dashboard visualization and trend analysis. The dashboard displayed live sensor data, pump and LED controls, notifications, and historical charts.
- Firebase was used for timestamped sensor records.
- The dashboard visualized pH, TDS, temperature, humidity, water level, and system status.
- Users could control pump and LED modes remotely.
- Historical readings supported trend analysis and system evaluation.
Prototype & Testing
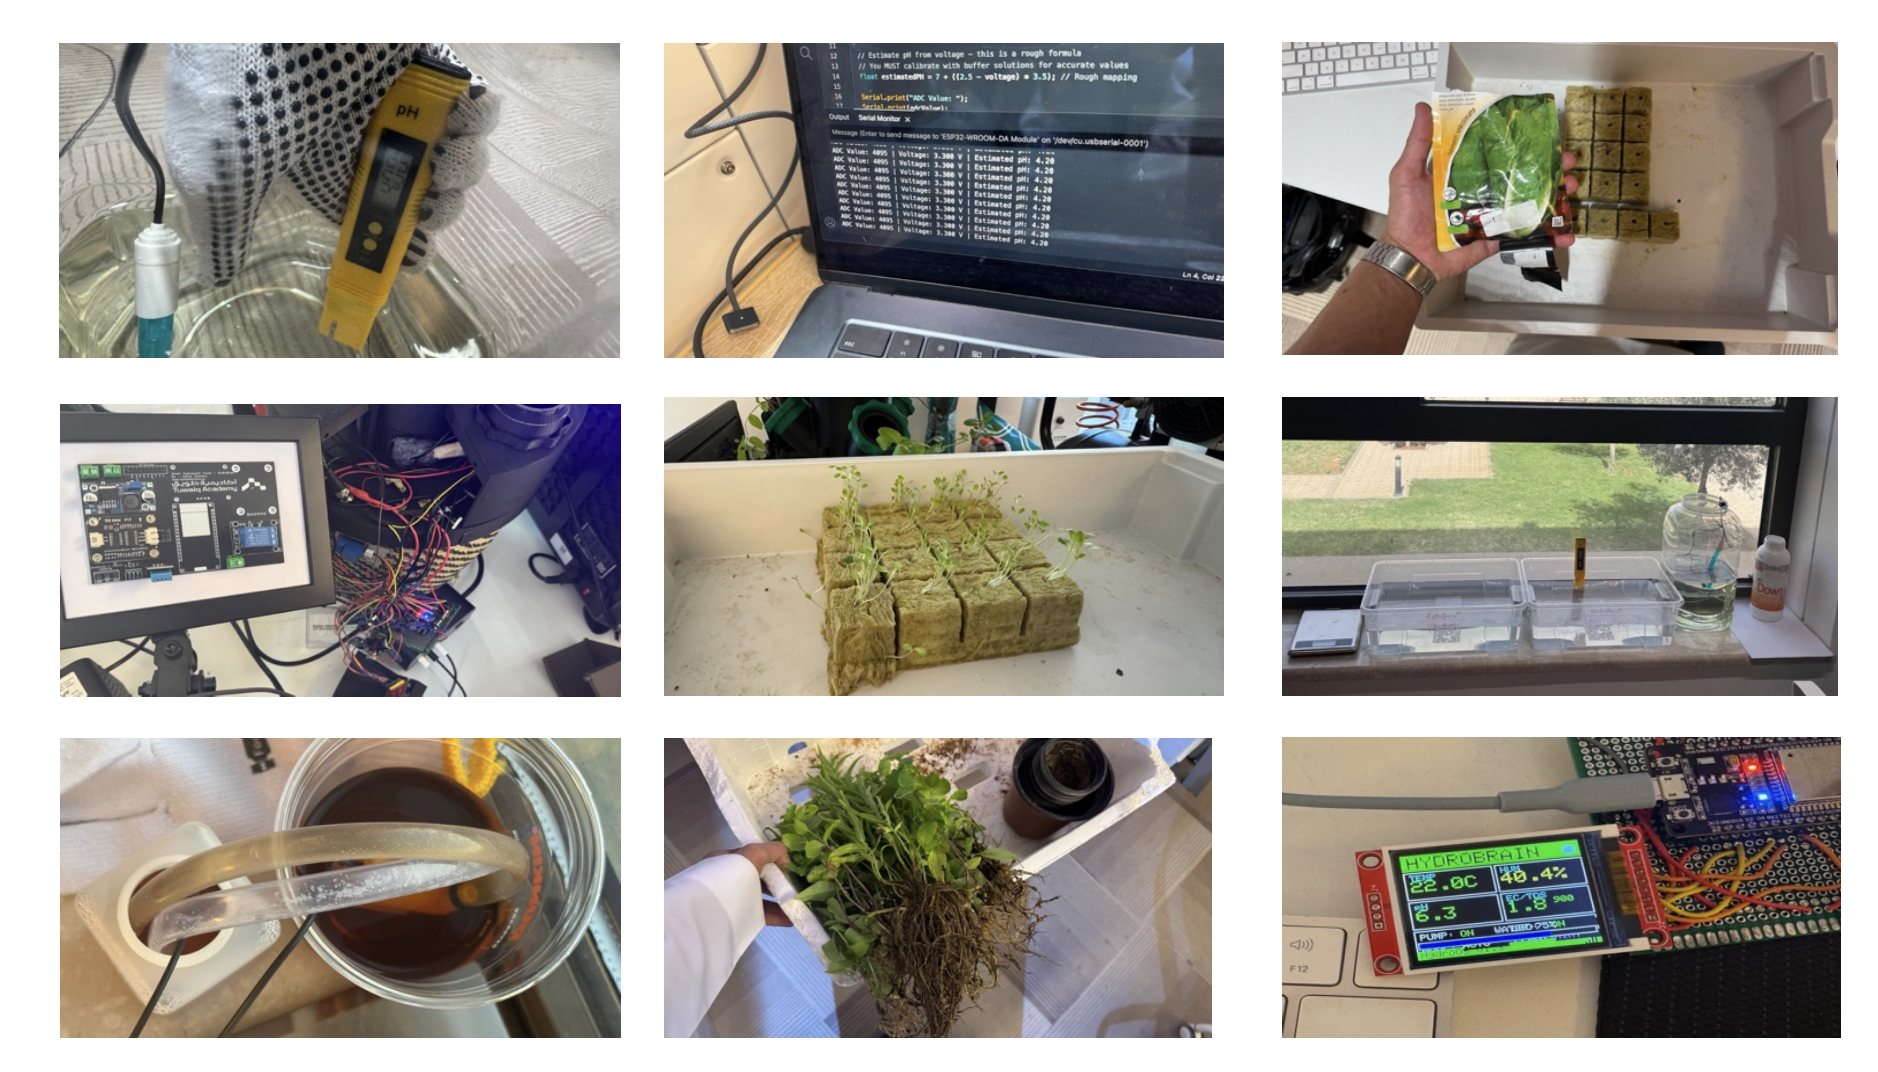
The prototype was assembled and tested in a controlled indoor environment. Testing validated the electronics, display, wiring, irrigation behavior, LED modes, dashboard connectivity, and real-time sensor streaming.
- Verified LED operation across Sun, Relaxing, and Sleeping modes.
- Tested web dashboard connectivity and remote control.
- Validated real-time data streaming from sensors.
- Confirmed water circulation through automated pump activation.
3D Design & Manufacturing
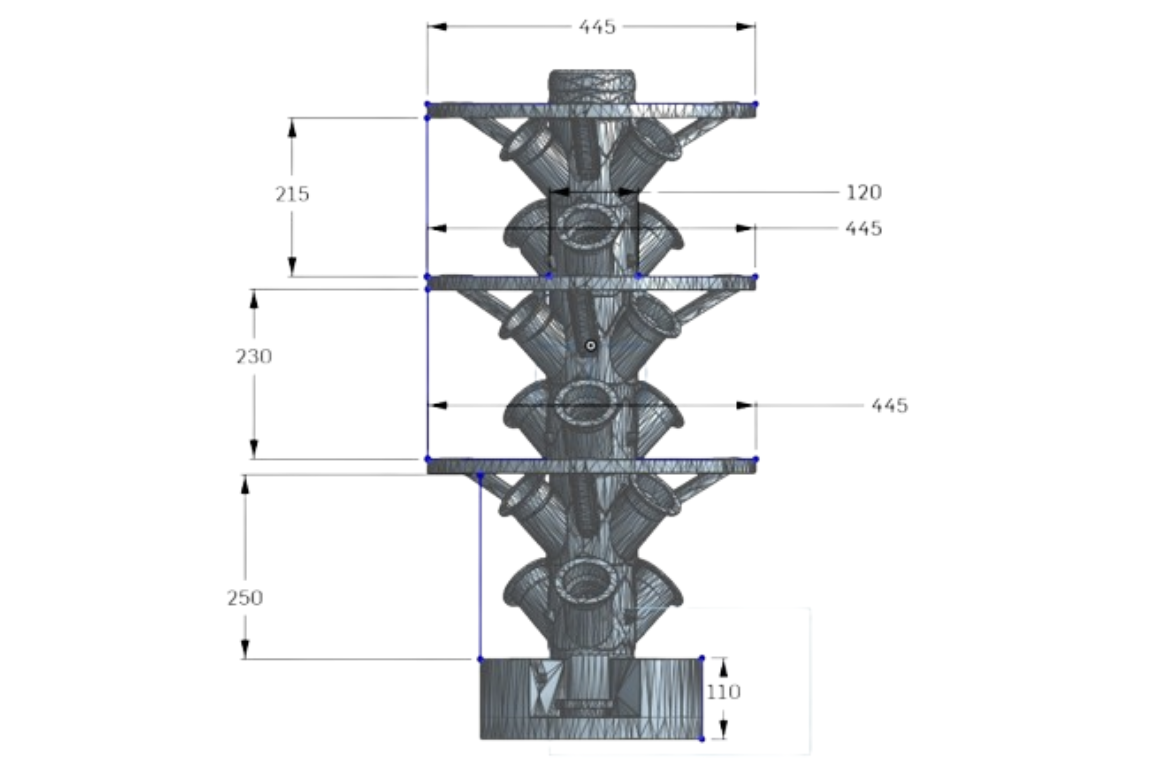
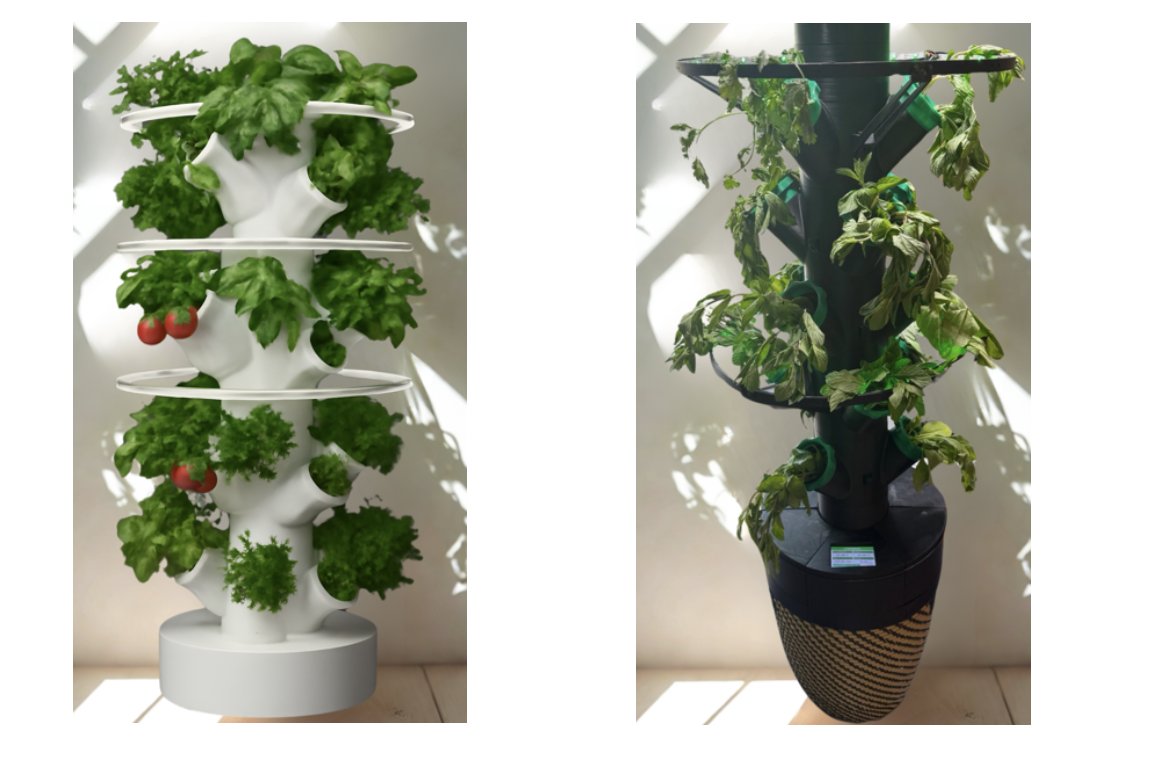
The product was designed with multiple 3D components, including tower segments, tank parts, plant pots, support structures, side screen window, electronics base, and electric box. These parts support modular assembly and future manufacturing.
- Modular tower body and plant holders.
- Dedicated electronics base and electric box.
- 3D-printed structural components for prototype validation.
- Design direction suitable for product iteration and manufacturing.